Hi,
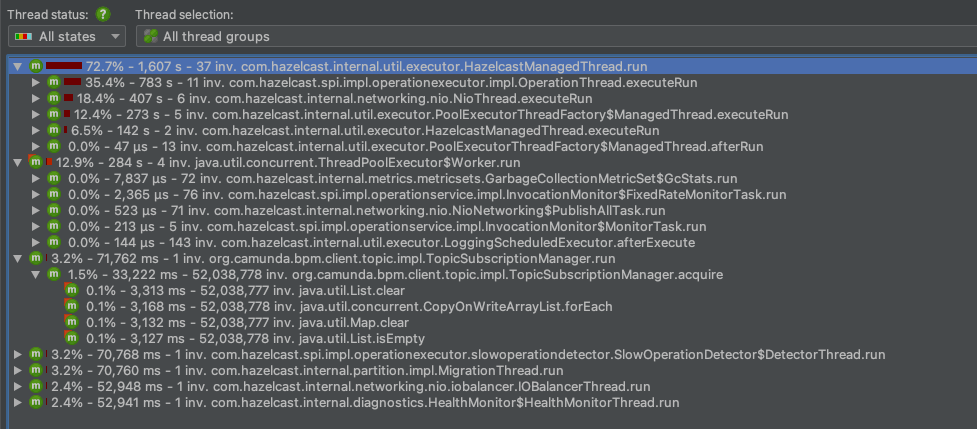
We’re running into some issues following the last A12 upgrade from 2024.06 to 2025.06, we are experience high CPU consumption as high as 1 CUP in idle state, tracing this down with jprofiler with shows high activity in hazelcast,
see figures below
There is however no changes to hazelcast configuration from our side, this is by default using the A12 hazelcast.xml provided.
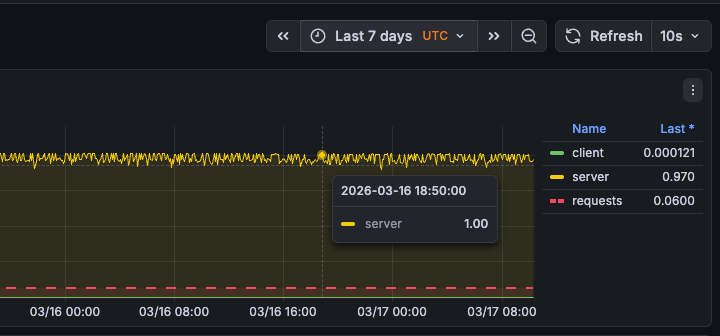
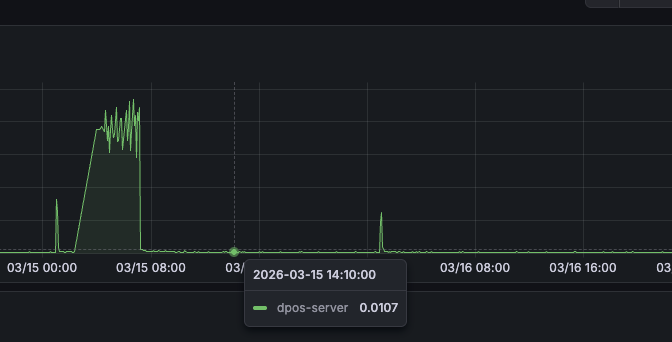
For perspective, this is what the application CPU usage looks like for 2024.06
ezekiel-risen-module:
Hi,
We’re running into some issues following the last A12 upgrade from 2024.06 to 2025.06, we are experience high CPU consumption as high as 1 CUP in idle state, tracing this down with jprofiler with shows high activity in hazelcast,
Hi,
Thanks for reporting this. We’ve identified the root cause - statistics collection overhead combined with inaccurate memory sizing .
Update hazelcast-caches.xml:
    <statistics-enabled>false</statistics-enabled>
    <in-memory-format>BINARY</in-memory-format>
for all maps, especially the default map. This will eliminate the CPU overhead from statistics and prevent cache thrashing due to inaccurate size estimation.
<!-- Change default map -->
<map name="default">
    <statistics-enabled>false</statistics-enabled>
    <in-memory-format>BINARY</in-memory-format>
    <time-to-live-seconds>1200</time-to-live-seconds>
    <eviction size="4" eviction-policy="LFU" max-size-policy="USED_HEAP_SIZE"/>
    <backup-count>0</backup-count>
    <async-backup-count>0</async-backup-count>
</map>
Disables statistics (line 2): Eliminates continuous counter updates on every cache operation. Statistics were multiplying CPU cost with 2025.06’s higher throughput.Adds BINARY format (line 3): Hazelcast can’t measure OBJECT sizes accurately (DocumentEntity with large CLOB appears as 100 bytes but is actually 1 MB). BINARY serialization provides exact sizes, preventing cache thrashing.
Please test this configuration and share your results
Thanks for having a look into this problem, I tested the suggested solution but the result was not so much different, the idle cpu consumption still range between 0.9xx to a full unit, and jprofiler is still pointing at hazelcast.
Hi,
Hi @dinh-sleek-chasm I attached the hazelcast.xml here, it’s a copy of the A12 hazelcast.xml with additional two changes in every map entry to disable statistics and set memory format to BINARY as suggested above.
see below;
<?xml version="1.0" encoding="UTF-8"?>
<hazelcast xmlns="http://www.hazelcast.com/schema/config" xmlns:xsi="http://www.w3.org/2001/XMLSchema-instance"
		   xsi:schemaLocation="http://www.hazelcast.com/schema/config https://www.hazelcast.com/schema/config/hazelcast-config-5.4.xsd">

	<!-- Change default map -->
	<map name="default">
		<statistics-enabled>false</statistics-enabled>
		<in-memory-format>BINARY</in-memory-format>
		<time-to-live-seconds>1200</time-to-live-seconds>
		<eviction size="4" eviction-policy="LFU" max-size-policy="USED_HEAP_SIZE"/>
		<backup-count>0</backup-count>
		<async-backup-count>0</async-backup-count>
	</map>

	<map name="validationCache">
		<time-to-live-seconds>3600</time-to-live-seconds>
		<eviction size="20" eviction-policy="LFU" max-size-policy="USED_HEAP_SIZE"/>
		<statistics-enabled>false</statistics-enabled>
		<in-memory-format>BINARY</in-memory-format>
	</map>

	<map name="securedModelReadCache">
		<time-to-live-seconds>36000</time-to-live-seconds>
		<eviction size="15" eviction-policy="LFU" max-size-policy="USED_HEAP_SIZE"/>
		<statistics-enabled>false</statistics-enabled>
		<in-memory-format>BINARY</in-memory-format>
	</map>

	<map name="com.mgmtp.a12.dataservices.model.GenericModel">
		<time-to-live-seconds>36000</time-to-live-seconds>
		<eviction size="5" eviction-policy="LFU" max-size-policy="USED_HEAP_SIZE"/>
		<statistics-enabled>false</statistics-enabled>
		<in-memory-format>BINARY</in-memory-format>
	</map>

	<map name="com.mgmtp.a12.kernel.md.model.api.IDocumentModel">
		<time-to-live-seconds>36000</time-to-live-seconds>
		<eviction size="5" eviction-policy="LFU" max-size-policy="USED_HEAP_SIZE"/>
		<statistics-enabled>false</statistics-enabled>
		<in-memory-format>BINARY</in-memory-format>
	</map>

	<map name="com.mgmtp.a12.dataservices.relationship.model.RelationshipModel">
		<time-to-live-seconds>36000</time-to-live-seconds>
		<eviction size="5" eviction-policy="LFU" max-size-policy="USED_HEAP_SIZE"/>
		<statistics-enabled>false</statistics-enabled>
		<in-memory-format>BINARY</in-memory-format>
	</map>

	<map name="com.mgmtp.a12.dataservices.cdd.jms.internal.ComposeDocumentModel">
		<time-to-live-seconds>36000</time-to-live-seconds>
		<eviction size="10" eviction-policy="LFU" max-size-policy="USED_HEAP_SIZE"/>
		<statistics-enabled>false</statistics-enabled>
		<in-memory-format>BINARY</in-memory-format>
	</map>

	<map name="documentModelIndexedFieldsCache">
		<time-to-live-seconds>0</time-to-live-seconds>
		<eviction size="5" eviction-policy="LFU" max-size-policy="USED_HEAP_SIZE"/>
		<statistics-enabled>false</statistics-enabled>
		<in-memory-format>BINARY</in-memory-format>
	</map>

	<!-- TODO A12S-5803: Implement Query validation phase V. -->
	<map name="queryOperatorsClassCache">
		<time-to-live-seconds>0</time-to-live-seconds>
		<eviction size="5" eviction-policy="LFU" max-size-policy="USED_HEAP_SIZE"/>
		<statistics-enabled>false</statistics-enabled>
		<in-memory-format>BINARY</in-memory-format>
	</map>

	<map name="modelGraphCache">
		<time-to-live-seconds>86400</time-to-live-seconds>
		<eviction size="5" eviction-policy="LFU" max-size-policy="USED_HEAP_SIZE"/>
		<statistics-enabled>false</statistics-enabled>
		<in-memory-format>BINARY</in-memory-format>
	</map>

	<map name="modelSubTypesMapCache">
		<time-to-live-seconds>86400</time-to-live-seconds>
		<eviction size="5" eviction-policy="LFU" max-size-policy="USED_HEAP_SIZE"/>
		<statistics-enabled>false</statistics-enabled>
		<in-memory-format>BINARY</in-memory-format>
	</map>

	<map name="userCache">
		<time-to-live-seconds>0</time-to-live-seconds>
		<eviction size="5" eviction-policy="LFU" max-size-policy="USED_HEAP_SIZE"/>
		<statistics-enabled>false</statistics-enabled>
		<in-memory-format>BINARY</in-memory-format>
	</map>

	<map name="tokenCache">
		<time-to-live-seconds>86400</time-to-live-seconds>
		<eviction size="1" eviction-policy="LFU" max-size-policy="USED_HEAP_SIZE"/>
		<statistics-enabled>false</statistics-enabled>
		<in-memory-format>BINARY</in-memory-format>
	</map>

	<map name="roleMapping">
		<time-to-live-seconds>86400</time-to-live-seconds>
		<eviction size="4" eviction-policy="LFU" max-size-policy="USED_HEAP_SIZE"/>
		<statistics-enabled>false</statistics-enabled>
		<in-memory-format>BINARY</in-memory-format>
	</map>

	<map name="com.mgmtp.a12.dataservices.document.internal.entity.DocumentEntity">
		<time-to-live-seconds>3600</time-to-live-seconds>
		<eviction size="50" eviction-policy="LFU" max-size-policy="USED_HEAP_SIZE"/>
		<statistics-enabled>false</statistics-enabled>
		<in-memory-format>BINARY</in-memory-format>
	</map>

	<map name="com.mgmtp.a12.dataservices.relationship.persistence.internal.jpa.entity.RelationshipLinkEntity">
		<time-to-live-seconds>3600</time-to-live-seconds>
		<eviction size="20" eviction-policy="LFU" max-size-policy="USED_HEAP_SIZE"/>
		<statistics-enabled>false</statistics-enabled>
		<in-memory-format>BINARY</in-memory-format>
	</map>

	<map name="com.mgmtp.a12.dataservices.relationship.persistence.internal.jpa.entity.RelationshipRoleEntity">
		<time-to-live-seconds>3600</time-to-live-seconds>
		<eviction size="20" eviction-policy="LFU" max-size-policy="USED_HEAP_SIZE"/>
		<statistics-enabled>false</statistics-enabled>
		<in-memory-format>BINARY</in-memory-format>
	</map>

	<map name="com.mgmtp.a12.dataservices.model.persistence.internal.jpa.entity.ModelEntity">
		<statistics-enabled>false</statistics-enabled>
		<in-memory-format>BINARY</in-memory-format>
		<time-to-live-seconds>0</time-to-live-seconds>
		<eviction size="15" eviction-policy="LFU" max-size-policy="USED_HEAP_SIZE"/>
	</map>

	<map name="com.mgmtp.a12.dataservices.model.persistence.internal.jpa.entity.ModelHeaderEntity">
		<statistics-enabled>false</statistics-enabled>
		<in-memory-format>BINARY</in-memory-format>
		<time-to-live-seconds>0</time-to-live-seconds>
		<eviction size="5" eviction-policy="LFU" max-size-policy="USED_HEAP_SIZE"/>
	</map>
	<map name="com.mgmtp.a12.dataservices.query.indexing.internal.persistence.entity.ModelFieldEntity">
		<statistics-enabled>false</statistics-enabled>
		<in-memory-format>BINARY</in-memory-format>
		<time-to-live-seconds>0</time-to-live-seconds>
		<eviction size="20" eviction-policy="LFU" max-size-policy="USED_HEAP_SIZE"/>
	</map>
	<map name="com.mgmtp.a12.dataservices.query.indexing.internal.persistence.entity.searchtable.DocumentFieldEntity">
		<statistics-enabled>false</statistics-enabled>
		<in-memory-format>BINARY</in-memory-format>
		<time-to-live-seconds>0</time-to-live-seconds>
		<eviction size="50" eviction-policy="LFU" max-size-policy="USED_HEAP_SIZE"/>
	</map>

	<map name="com.mgmtp.a12.dataservices.query.indexing.internal.persistence.entity.jsonb.DocumentSearchEntity">
		<statistics-enabled>false</statistics-enabled>
		<in-memory-format>BINARY</in-memory-format>
		<time-to-live-seconds>0</time-to-live-seconds>
		<eviction size="50" eviction-policy="LFU" max-size-policy="USED_HEAP_SIZE"/>
	</map>

</hazelcast>
hi @ezekiel-risen-module ,
Sorry for the late response. I spent some time attempting to reproduce the issue based on your report, but so far, the CPU usage remains within an acceptable range on my end.
To help me investigate further and solve this bottleneck, could you please provide more details about your specific case? I would appreciate it if you could answer the following:
Data Volume: How many models and documents are being processed when the spike occurs?Document Size: What is the average size of the documents (e.g., in KB or MB)?Environment: Are there any specific CPU limits or resource constraints configured in your environment (e.g., Kubernetes limits)?Logs & Metrics: Are you seeing any specific error patterns or long Garbage Collection (GC) pauses in the logs?Reproducibility: Does this happen consistently with every reindex, or only with specific datasets?
If possible, providing a thread dump or a CPU profile during the spike would be extremely helpful for my analysis.
Thank you for your help!
@dinh-sleek-chasm Thanks for the analysis, we have found other bottleneck with Camunda that kept the cpu high in idle state even after the changes to the hazelcast, jprofiler somehow wasn’t able to sample this part of the application for some reason yet unknown to me. I will check again the different between the original hazelcast config and the custom and let you know if it helps us more.